
Turkey’s primary energy supply [= energy production (+) energy imports (-) energy exports (-) international bunkers (+ or -) stock changes] increased by about 60 percent from 2005 to 134.6 million tonnes of oil equivalent (Mtoe) in 2016, and might reach 222.4 Mtoe by 2020. With imports accounting for about 75 percent of the supply, Turkey remains heavily dependent on energy imports (OECD/IEA, 2016).


Total final consumption increased by 42 percent between 2005 and 2015 to 93.5 Mtoe.[1],[2] Total consumption is expected to rise by more than 80 percent to 170.3 Mtoe by 2020. Charts 1 and 2 suggest that energy supply and consumption per capita, respectively, are below those of OECD-member European countries that serve as reference.
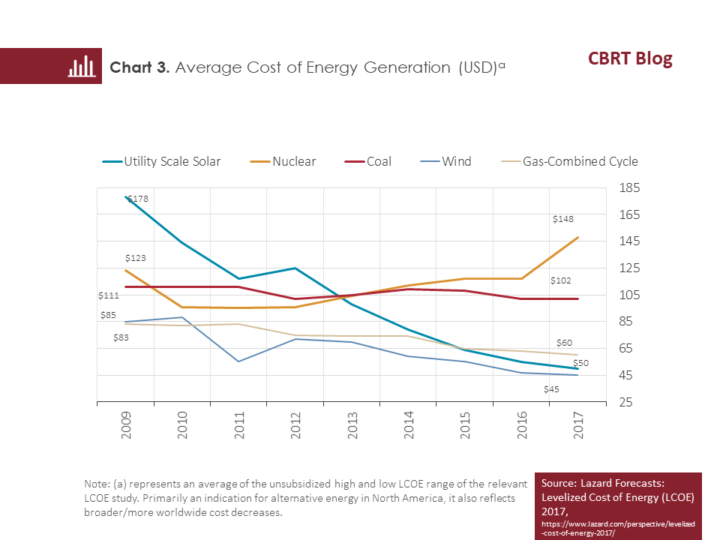
It is important to shift energy supply towards local resources to meet the investment need and reduce the dependence on imports. To this end, policy makers have not only launched programs regulating the energy market but have also taken initiatives to attract investment in alternative energy sources. Local energy sources are also essential to lower-cost energy generation (Chart 3) and supporting sustainable and environmentally friendly growth.
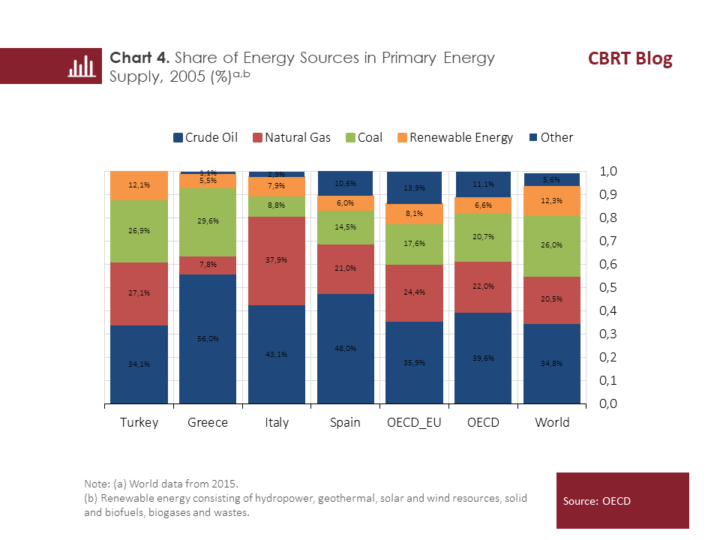
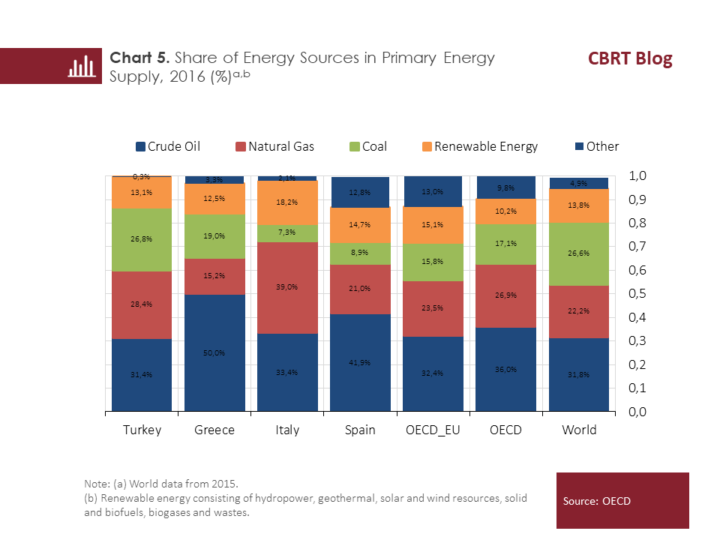
The danger of running out of fossil-fuel energy inputs such as natural gas, oil and coal and climate/environmental issues paved the way for increased use of renewable energy sources. Accordingly, some countries both imposed new energy/environmental taxes that raised the cost of using fossil fuels and encouraged renewable energy investments through incentives as well as R&D and financing support (Çelikkaya, 2017). As a result, the share of renewable energy in total supply was up around 12 percent from 2005 across the world in 2016 (Charts 4 and 5). The rate of increase was 56 percent for OECD member states and more than 86 percent for high-income European countries. Turkey has a higher rate of renewable energy use than the OECD average but the rate of increase has proved far from satisfying. The overall outlook signals a still-marginal share of renewable energy sources in energy generation. The ongoing subsidies for fossil fuels, the failure to incorporate pollution costs into the cost of burning fossil fuels and the remarkably high initial capital cost of renewable energy technologies are among the main reasons behind this outcome (Çelikkaya, 2017).


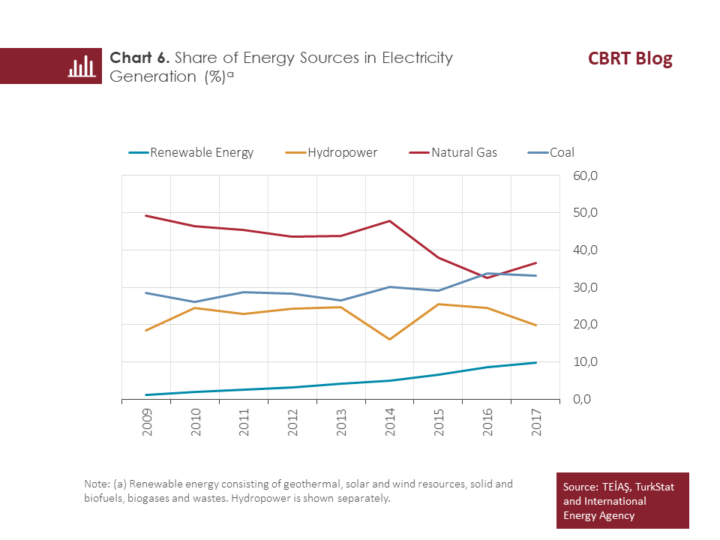
The share of renewables in electrical power generation has been growing over the last ten years. Except for hydroelectric energy, this ratio increased from 1.2 percent in 2009 to 10 percent in 2017 (Chart 6). Renewable energy has a particularly dampening effect on natural gas use. The share of natural gas in energy generation went down from 49 percent in 2009 to 32.5 percent in 2016. However, it went back up to 36.6 percent in 2017 due to the falling weather-sensitive hydropower use.
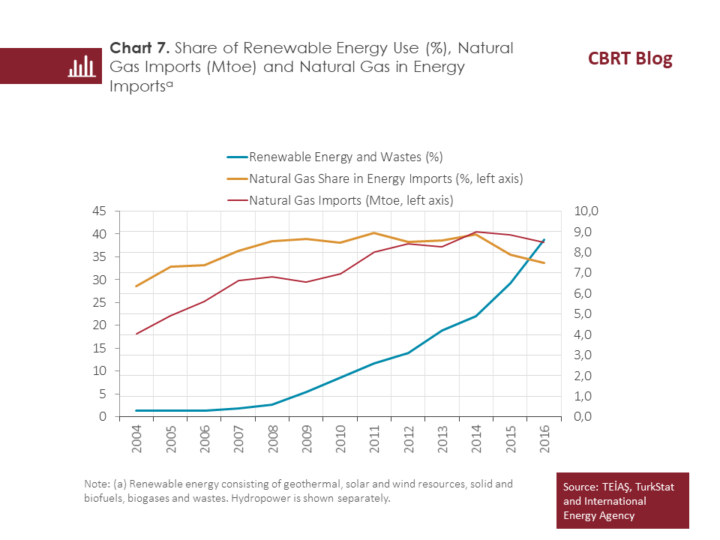
Using renewable energy sources has first-round effects on natural gas imports, thus the current account deficit. The amount of imported natural gas (Mtoe) rose by an average of 11 percent year-on-year from 2004 to 2008 but the increase slowed to 5 percent between 2009 and 2014 amid growing renewable energy consumption (Chart 7). However, there is a net decline for the last two years. In 2016, renewable energy use grew by 76 percent from 2014, while natural gas imports were down 6 percent. Similarly, after a steady uptrend in the beginning of the period, the share of imported natural gas in total energy imports remained broadly horizontal between 2009 and 2014, but then fell to 40, 35.5 and finally 33.7 percent in 2014, 2015 and 2016, respectively.


Directing investments towards renewable energy sources may dampen the use of imported fossil fuels but particularly boost the imports of components and equipment required for initial setup. For example, the imports of solar power components went up from 270 million US dollars in 2009 to 4.4 billion US dollars in 2017.[3] Meanwhile, the imports of wind power components amounted to 800 million US dollars in 2017. For these two sectors, total net imports accounted for 12 percent of the trade balance in 2017, up from 1 percent in 2009. As stated in the European Commission Report of 2014, the EU-27 countries showed a similar pattern. However, it is clear that this increase is largely due to one-time setup costs, and import expenses are significantly lower after a while.
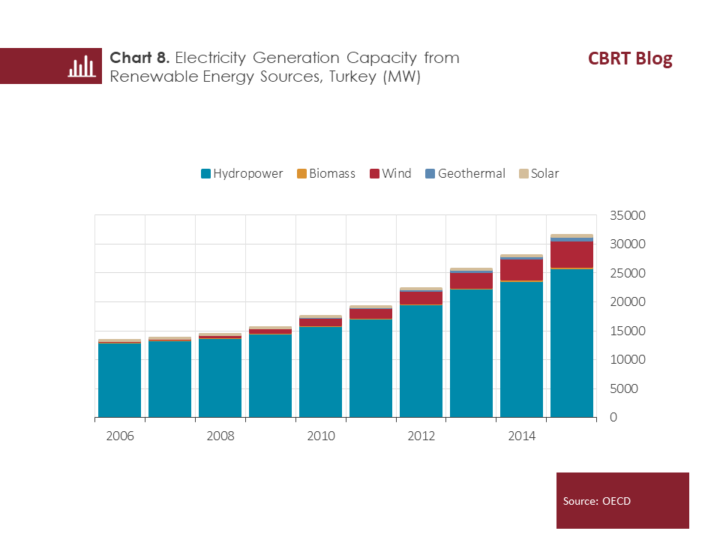
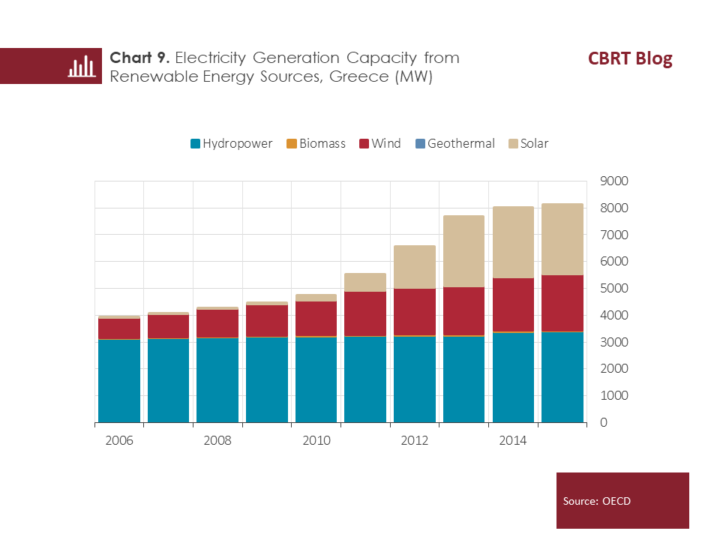
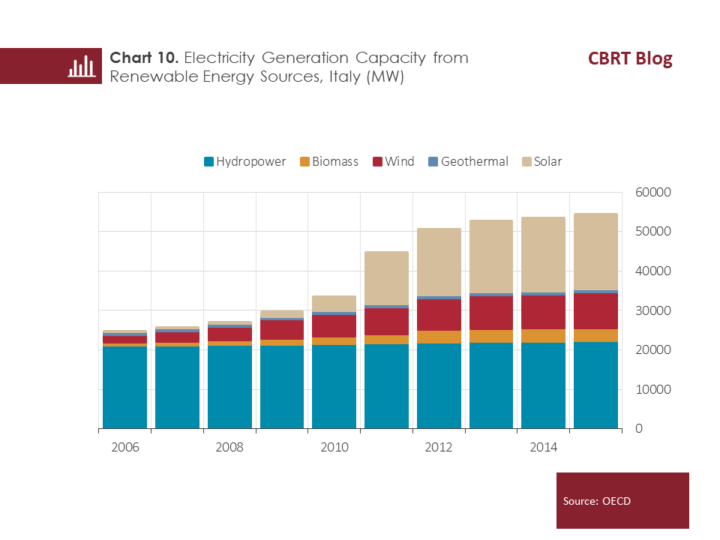
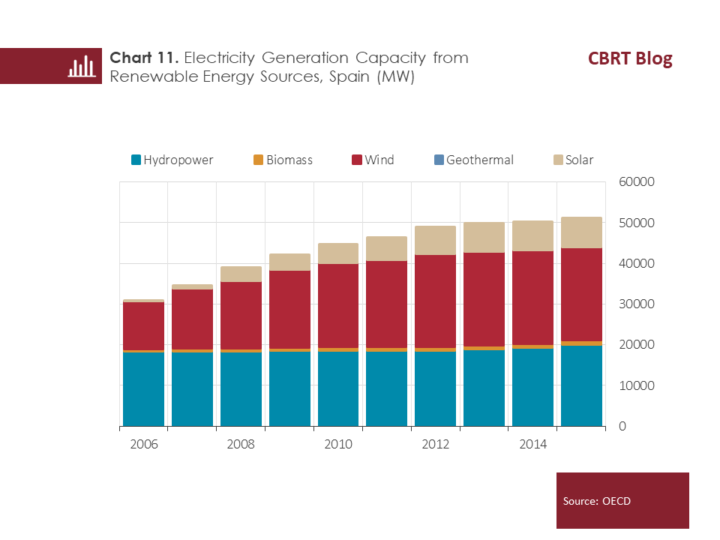
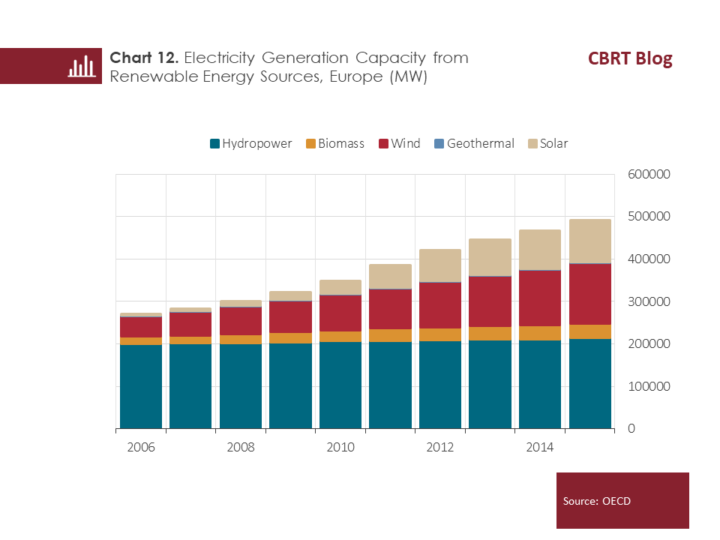
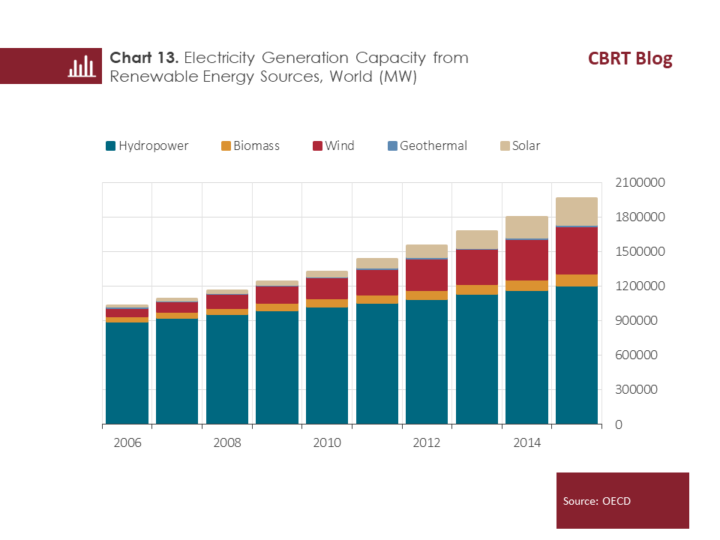
A country’s geographical location and natural resources determine the types of energy that it will consume heavily and efficiently. Therefore, planning investments according to natural resources may render energy policy more effective. Three relevant observations can be drawn from Charts 8 to 13. (1) The electricity generation capacity from renewable energy sources is on the rise across all countries. (2) While other countries generally favor a diversified energy mix, Turkey mostly produces hydroelectric power. The share of hydroelectricity fell as low as 82 percent in 2015, down from 98 percent in 2006. According to data from the Ministry of Energy and Natural Resources, this figure was 77 percent in 2016. However, the droughts of the past few years have reminded policy makers that dependence on a single energy source like hydroelectric power generation has its downsides. (3) Compared to Italy and Greece, Turkey has failed to invest enough in geographically abundant resources such as solar and wind power. Wind energy has been growing since 2009 but there is still a long way to go. Solar energy has only been around since 2014. However, Chart 3 shows that these resources can generate electricity at a much lower cost than others.


 The high upfront costs of foreign technologies point to the need for state support for renewable energy deployments. In this regard, the recently improved amounts of guarantee payments have received positive feedback from the sector. The relevant legislation makes entrepreneurs willing to invest in this market exempt from VAT and customs duties. The state guarantee to buy energy generated from solar power is another incentive. The state promotes rooftop and small systems, especially rooftop solar panels. Such incentives stimulated investments in the sector. According to TEİAŞ data, the total installed capacity of renewable energy rose from 13.6 gigawatt (GW) in 2007 to 34.6 GW in 2016.
Nevertheless, it is highly important to encourage local technical equipment and build a high-tech labor force familiar with this technology for the future of the sector. Another technical aspect concerns energy storage and distribution. Therefore, it is crucial to follow new technologies related to large-scale rechargeable batteries, portable power and charging stations. Taking measures to save energy across residential, industry, transport and services sectors and integrating renewable energy sources into energy systems will help direct the demand for energy towards local resources. Hence, both the search for alternative resources and the attempts to change energy consumption behavior should be supported.
[1] Total final consumption is the electricity, heat, gas and petroleum products consumed by industry, transport, households, commercial and public services, and sectors such as agriculture and fishing. The amount consumed does not involve the amount of fuel used for networks and energy generation. Total energy demand equals the sum of fuels used for energy consumed by sectors and energy generation.
[2] Industry, transport, households and commercial and public services accounted for 93.5, 26.2, 24.3, 20.1 and 12.2 Mtoe of energy consumption, respectively, in 2015.
[3] Commercial data on components and equipment used in solar and wind energy investments are sorted by the HS code in Box III.2.1 of the European Commission’s 2014 report on Energy Economic Developments in Europe. Data from the UN Comtrade, at 6-digit HS level.
References
Çelikkaya, A., 2017. Yenilenebilir Enerjinin Teşvikine Yönelik Uluslararası Kamu Politikaları Üzerine Bir İnceleme. Maliye Dergisi, No: 172, 52-84.
European Commission, 2014. Energy Economic Developments in Europe.
OECD/IEA, 2016. Energy Policies of IEA Countries, Turkey 2016 Review.