In the aftermath of the global financial crisis, it became more important to identify the risks and vulnerabilities to which countries are exposed. “Debt stock” is one of the key variables in such risk and vulnerability assessments. This study presents an analysis of Turkey’s total debt on a sectoral breakdown and in proportion to Gross Domestic Product (GDP) as well as a comparison with European Union and other peer countries.
Our study uses the data from Financial Accounts[1] tables, produced by the Central Bank of the Republic of Turkey (CBRT) in quarterly periods according to the United Nations National Accounts System and based on the European Union (EU) definition of debt, to enable an international comparison. According to that method, the total debt of domestic sectors is composed of the sum of currency and deposits, debt securities and loans under the liabilities section of financial balance sheets.

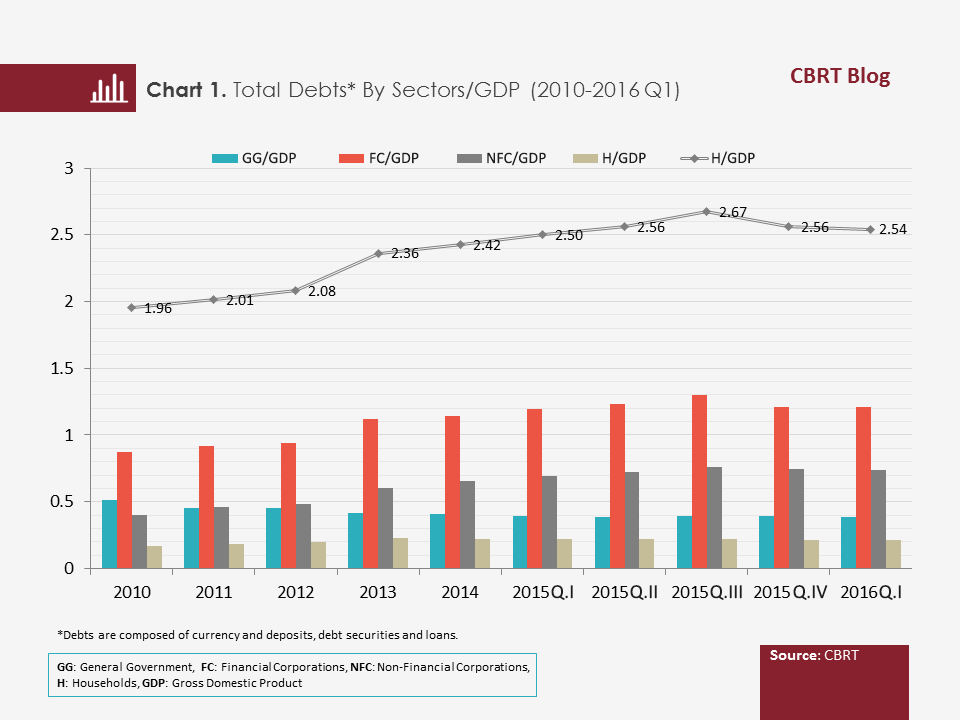
An analysis of “total debt/GDP”, comprising the sum of sectors’ debt, suggests that although it had assumed an uptrend between 2010 and the third quarter of 2015, it showed a downturn afterwards. It is noteworthy that the uptrend seen until 2015 Q3 was driven by the debts of financial corporations and non-financial corporations, yet debts of both sectors started to trend down after this period. An insight into the other sectors reveals that the ratio of general government debt to GDP generally displays a downward trend and the ratio of household debt to GDP is flat at low levels.

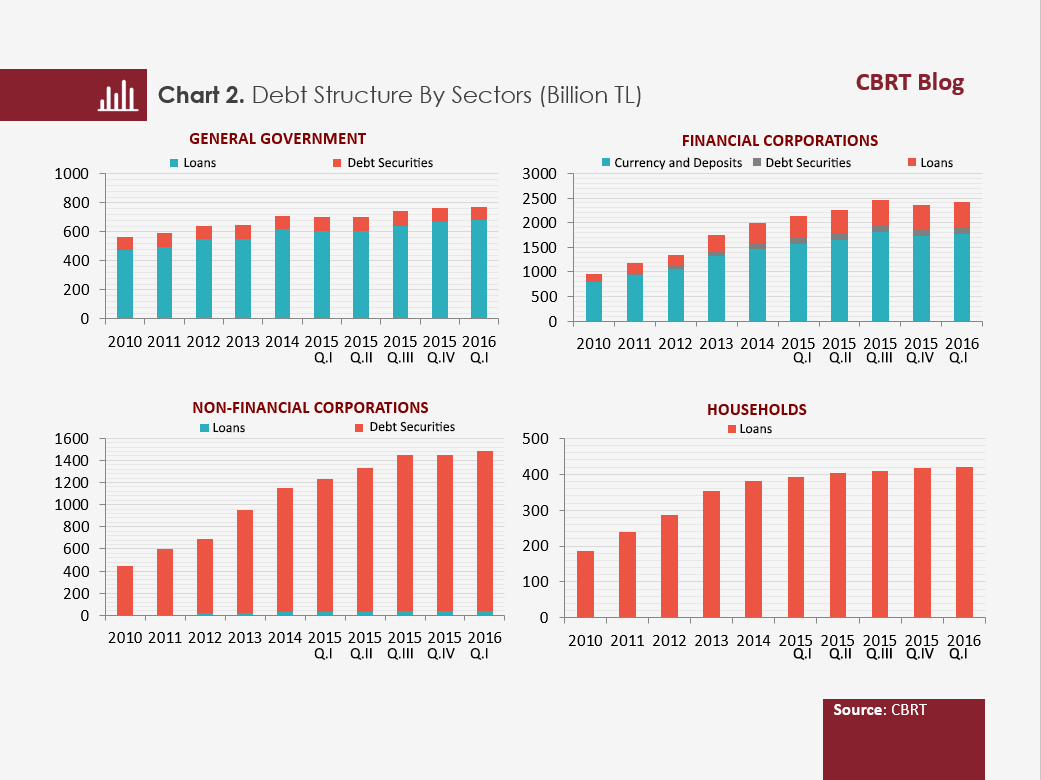
Looking at the domestic sector debt structure in terms of debt instruments indicates that the debts of the general government are mainly composed of debt security issues, whereas those of financial corporations (including the Central Bank) mainly consist of currency and deposits. Debts of non-financial corporations and households are predominantly comprised of loans, as is to be expected.

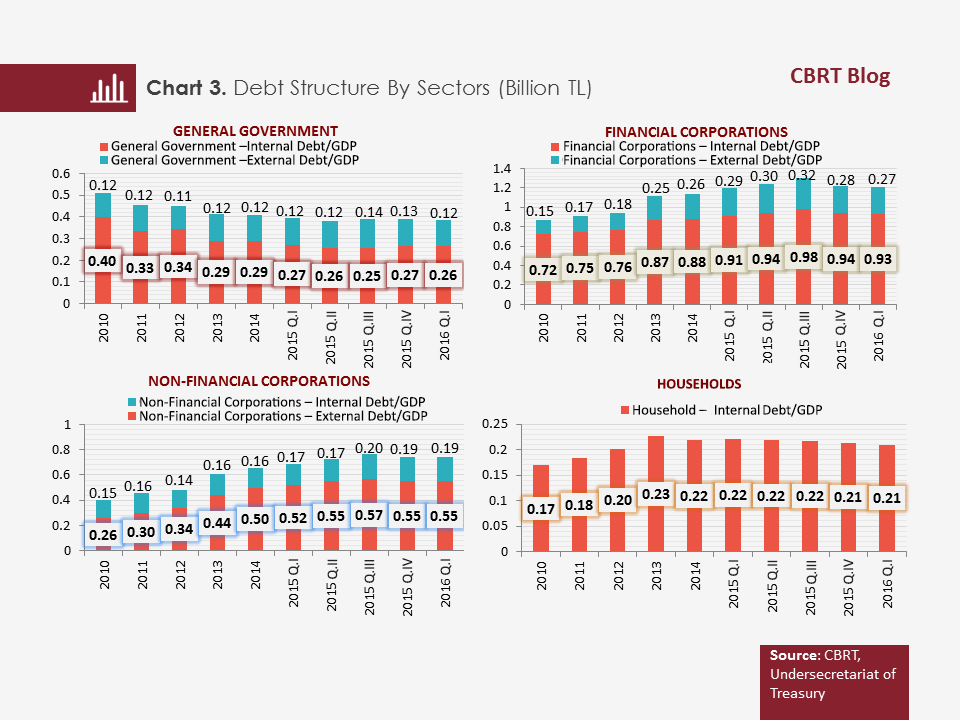
What is more, for this study, debts have been broken down into internal and external debt for each sector by subtracting the “External Debt Stock” data published by the Undersecretariat of Treasury from the total debt of domestic sectors. These calculations reveal that the decline in general government debts from 2010 to 2016 Q1 was mainly triggered by the decline in internal debts. The rise in financial corporations’ debts is associated with the increase in both the internal and external debts. Although internal and external debts of non-financial corporations also show an increase, it is apparent that the increase in internal debts is the main driver behind the rise in total debts. Households, by definition, do not hold external debt.
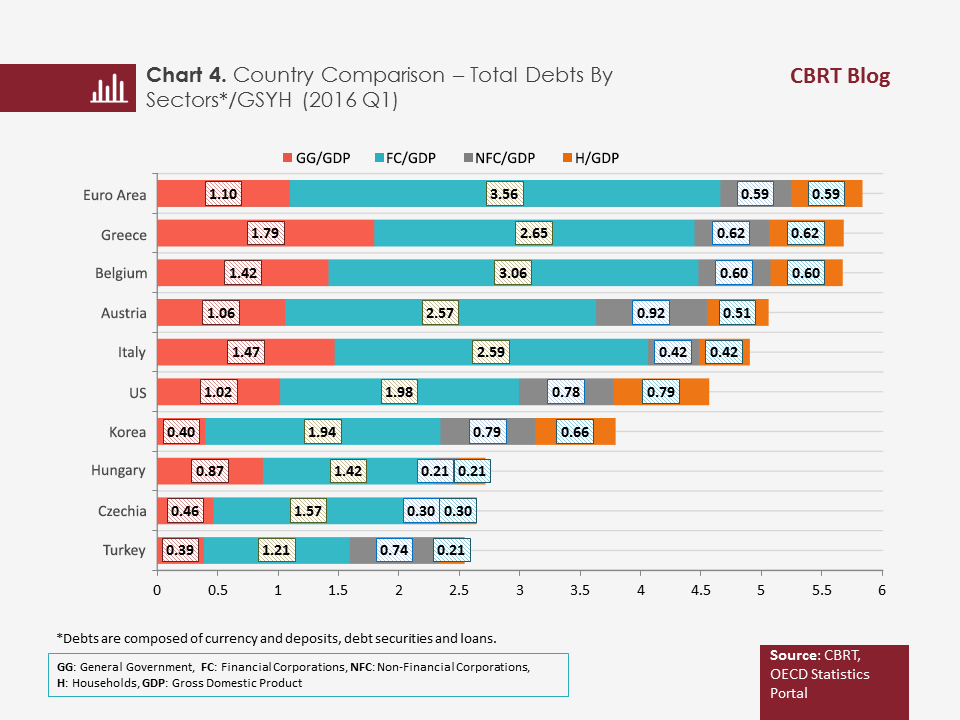
 A comparison of the “total debt/GDP” ratios of selected countries calculated from Financial Accounts data reveals that Turkey’s gross total debt is approximately 2.5 times its GDP, which stands out as the lowest ratio among other countries examined. On the other hand, the debts of general government, households and financial corporations in Turkey were quite low compared to those of other countries in the first quarter of 2016. It is noteworthy that although non-financial corporations’ debt is higher relative to that of some other countries compared, it is close to the Euro area level.
In brief, the total debt of resident sectors in Turkey is mostly driven by internal debts and its ratio to GDP has been on the decline since the third quarter of 2015, remaining at low levels compared to the selected countries.
Footnotes:
