
Driven by escalating geopolitical uncertainties worldwide and large-scale gold purchases by central banks, gold prices in US dollar terms surged by approximately 77% between September 2023 and April 2025 (Chart 1). In Türkiye, where gold has long been regarded as a traditional means of storing wealth, this price increase has contributed to a notable rise in the share of gold within total deposits (Chart 2).[1], [2] For households holding a significant share of their savings in gold, the price surge implied a substantial increase in wealth. Such an increase in wealth is likely to result in stronger consumer demand. In this blog post, we examine the impact of the increase in gold prices on main durable goods markets- particularly housing and automobiles- by- using the variations in gold deposit shares across Türkiye’s provinces.[3]


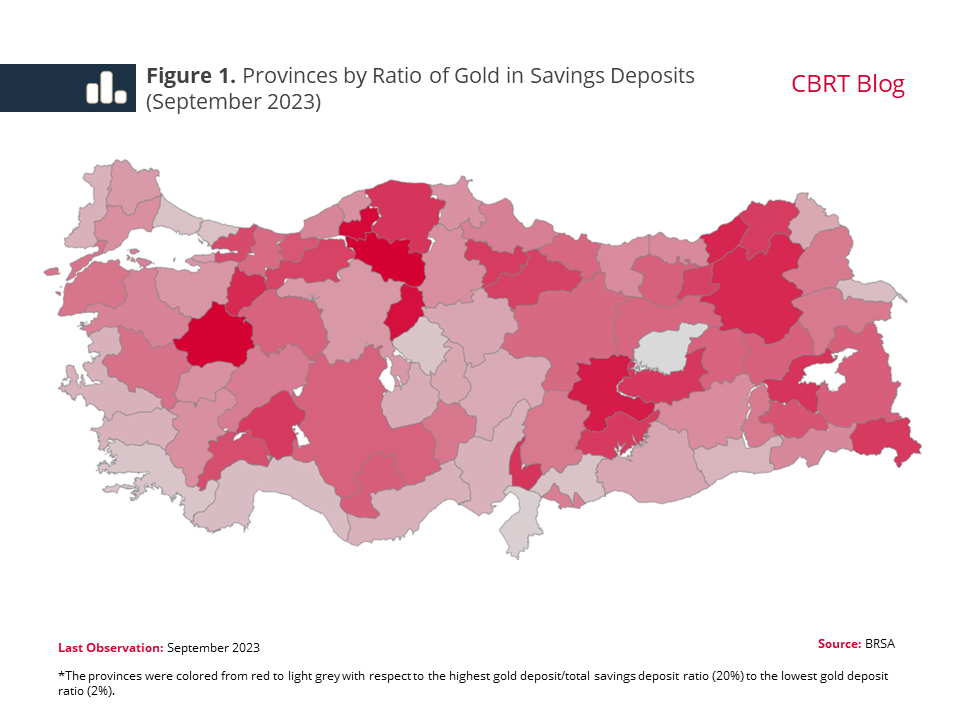
The ratio of gold deposits to savings deposits exhibited significant heterogeneity across provinces, even before gold started its recent surge as of September 2023 (Figure 1). As no specific events occurred after this period that would have caused substantial divergence among provinces, this heterogeneity in gold savings offers a natural setting to study the wealth effect of gold price changes on the housing and automobile markets.[4]
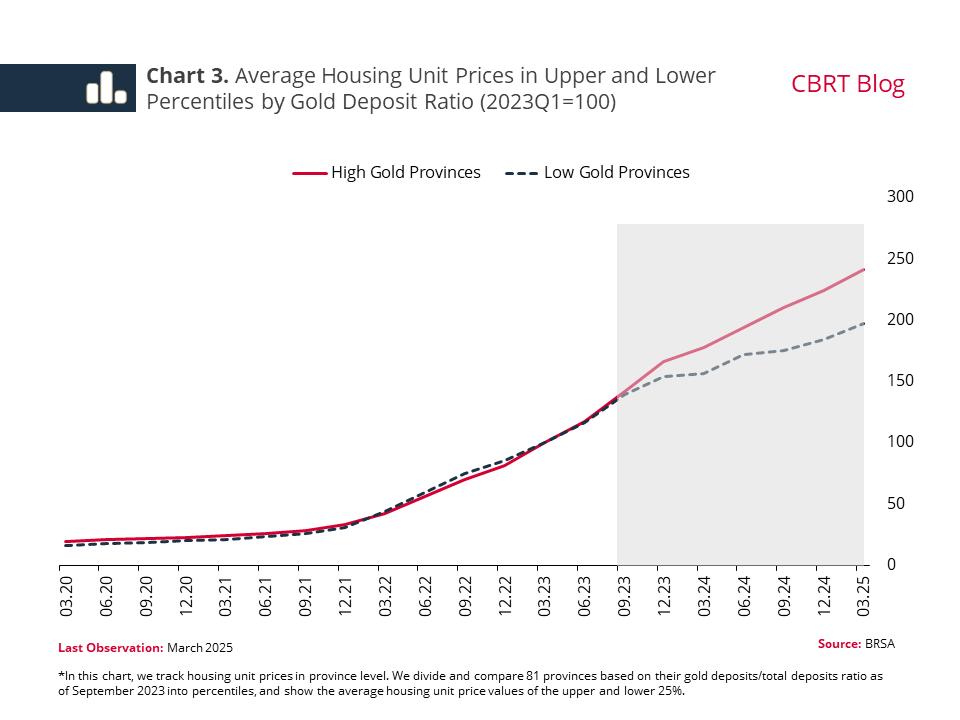
We see a clear sign of a wealth effect, as housing prices in provinces with higher gold deposit shares have increased more notably than other provinces since the last quarter of 2023 (Chart 3).
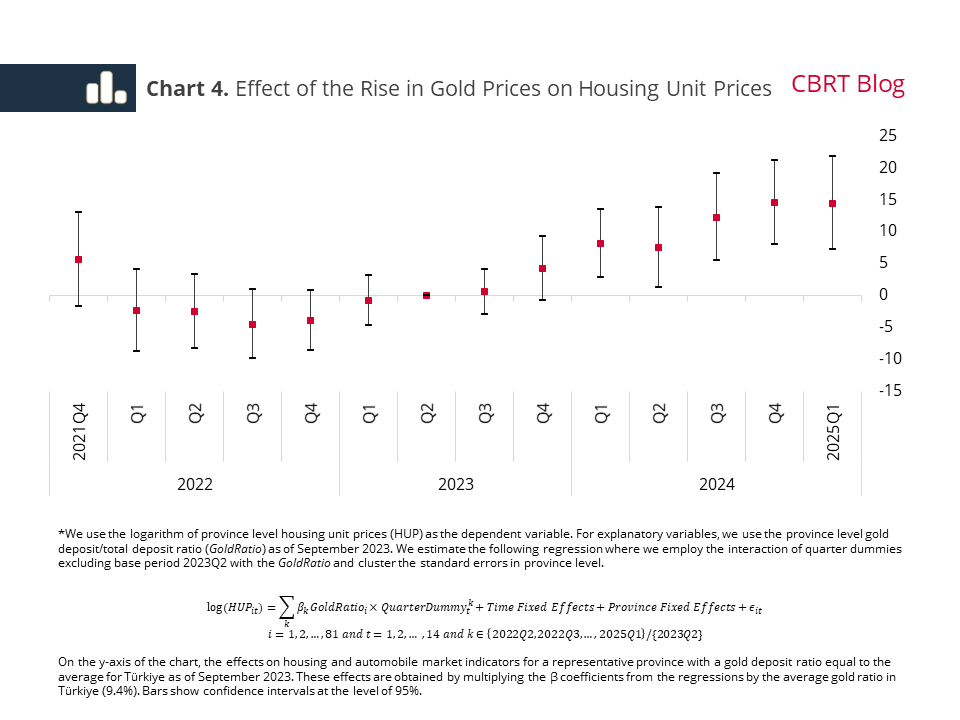
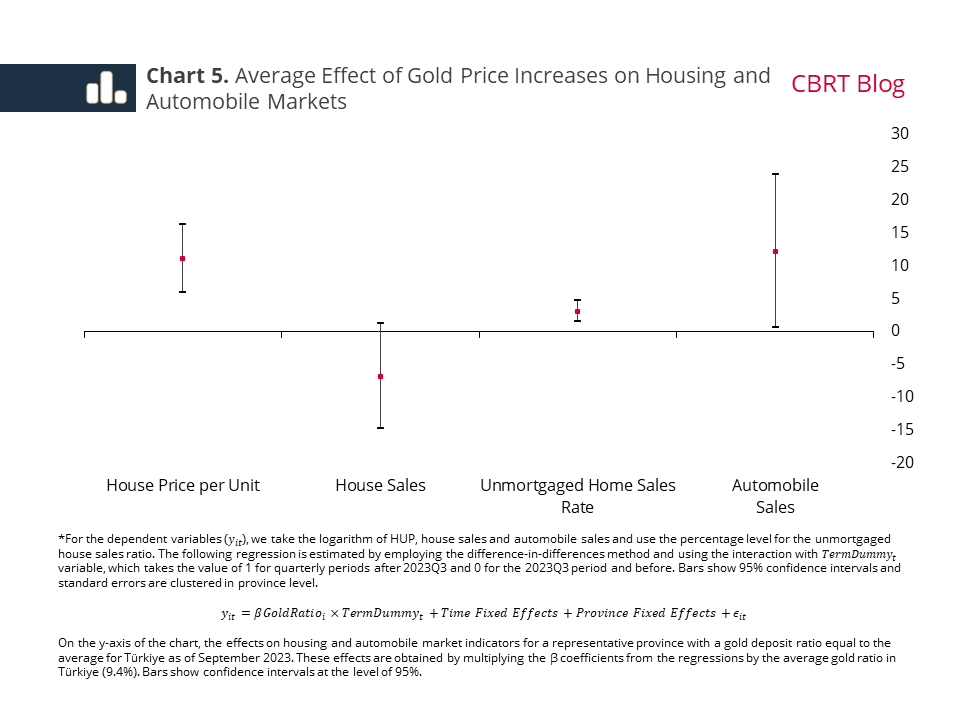
To empirically test the effects of gold price-driven wealth growth on the housing and automobile markets, we conduct a difference-in-differences analysis that leverages the variation in the gold deposit ratios across provinces. Chart 4 shows, on a quarterly basis, the additional effects of rising gold prices on housing unit prices for a province with a gold deposit ratio equal to the national average (9.4%) as of September 2023. In Chart 5, we also show the gold-driven average additional effects in various housing and automobile market indicators throughout 2023Q3-2025Q1 for a province with the national average gold deposit ratio. The results of the analysis reveal that:
- There was no significant correlation between housing unit prices and the gold deposit ratio prior to the increase in gold prices. However, from the fourth quarter of 2023 onwards, we observe a positive and statistically significant relationship (Chart 4). After controlling for time-invariant characteristics affecting housing prices, we find that for a representative province with the average gold ratio, gold price increases are linked to an additional 11% rise in house prices after 2023Q3. This suggests that the wealth effect resulting from the gold price surge had an upward impact on housing prices (Chart 5).
- The total number of house sales does not exhibit a significant relationship with provincial-level gold deposit ratios. This likely reflects the short-term inelasticity of housing supply in response to demand changes, meaning that rising demand primarily shows up in higher prices rather than an increase in sales.
- The share of unmortgaged sales- where the wealth effect is expected to be more pronounced- in total housing sales rises relatively more as the share of gold in deposits increases across provinces. This suggests that households are using their gold-related wealth to buy homes without relying on credit, and that demand remains strong even amid tight financial conditions.
- Automobile sales have increased relatively more in provinces with high gold deposit holdings following the hike in gold prices.[5] Unlike housing, the automobile market features a more elastic supply, which allows demand growth to result more directly in higher sales.
In summary, our analyses indicate that the surge in gold prices after September 2023 boosted demand in both the housing and automobile markets. While this increased demand is reflected in higher prices in the housing market, where supply is relatively inelastic, it translates into higher sales in the automobile market, which exhibits a relatively elastic supply.
[1] World Gold Council, Central Bank Statistics.
[2] Similarly, physical gold holdings are also estimated to have increased. For further information: CBRT, Inflation Report 2025-I, Box 2.5 Valuation Effect on Household Assets.
[3] Theoretically, an asset prices-driven increase in household wealth may lead to a rise in consumption demand and accordingly in prices of goods and services (Chodorow-Reich et al., 2021, Mian and Sufi 2011). Recently, there are also studies on the impact of price fluctuations in alternative investment instruments, such as cryptocurrencies, on consumption and local house prices (Aiello et al., 2023).
[4] In our analyses of the share of gold accounts in domestic savings accounts (the gold ratio) that we use to represent the gold savings preference, we find that the gold ratio is negatively correlated with the share of total financial system savings in GDP (even when socioeconomic variables are controlled for). This suggests that the gold share in deposits is a good indicator for the total gold savings tendency within and outside the system.
[5] TURKSTAT Motor Vehicle Statistics are used for new car sales (new registrations) in this blog post.
References
Aiello, Darren & Baker, Scott R. & Balyuk, Tetyana & Di Maggio, Marco & Johnson, Mark J. & Kotter, Jason D., 2023. "The Effects of Cryptocurrency Wealth on Household Consumption and Investment" NBER Working Papers 31445, National Bureau of Economic Research, Inc.
Chodorow-Reich & Gabriel, Plamen T. Nenov & Alp Simsek. 2021. "Stock Market Wealth and the Real Economy: A Local Labor Market Approach" American Economic Review, 111 (5): 1613–57.
Mian, A. & Sufi, A., 2011. “House Prices, Home Equity-Based Borrowing, and the US Household Leverage Crisis”. American Economic Review 101 (5), 2132–56.
CBRT, Inflation Report 2025-I, Box 2.5 Valuation Effect on Household Assets.