
Card spending data is used extensively to monitor demand conditions as it offers timely information at a high frequency.[1] Until 2021, this indicator tracked closely with the private consumption component of Gross Domestic Product (GDP). However, in recent years, card expenditures have accelerated and diverged from private consumption. This divergence reflects not only changes in demand but also a structural shift in consumer payment behavior-from cash to cards. In this blog post, we construct a long-term series for card usage rates and adjust card spending data for shifts in payment preferences, allowing for a more accurate assessment of underlying demand trends.
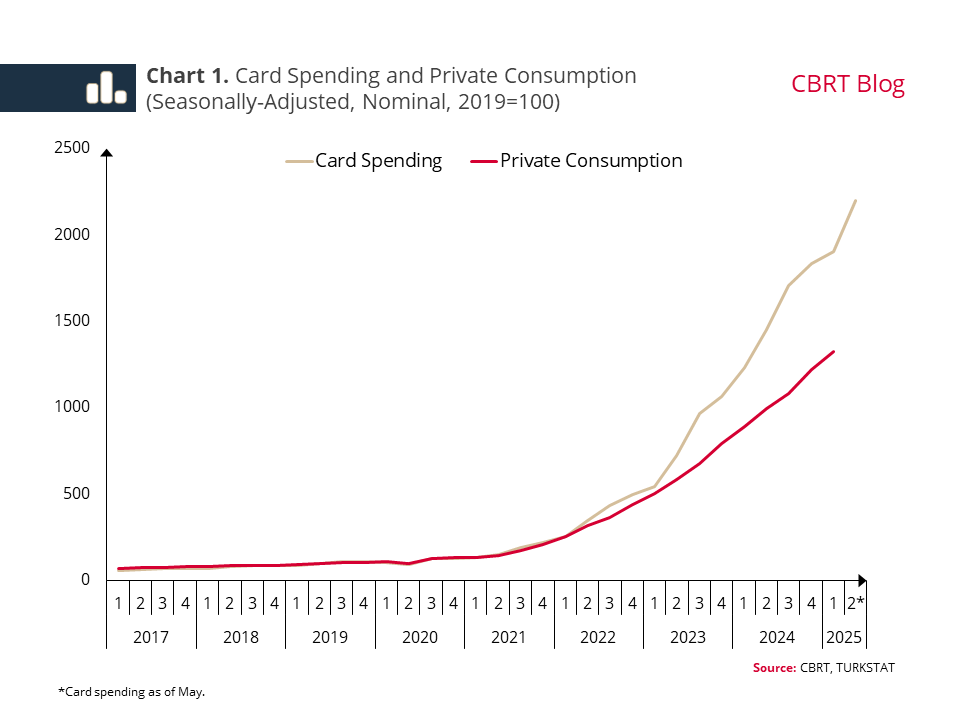
Card spending has surged in recent years (Chart 1). While this is partly driven by demand-side dynamics, the transition from cash -traditional payment method- to cards also plays a significant role. Indeed, recent studies reveal that the frequency of card payments has increased notably. This rise is attributed to technological advancements leading to digitalization and wider use of contactless payment systems, as well as rising inflation, which makes carrying cash more costly.
Therefore, interpreting card spending data requires careful consideration of these behavioral changes. In order to accurately isolate demand-driven developments, we first need to estimate the card usage rate as a time series.
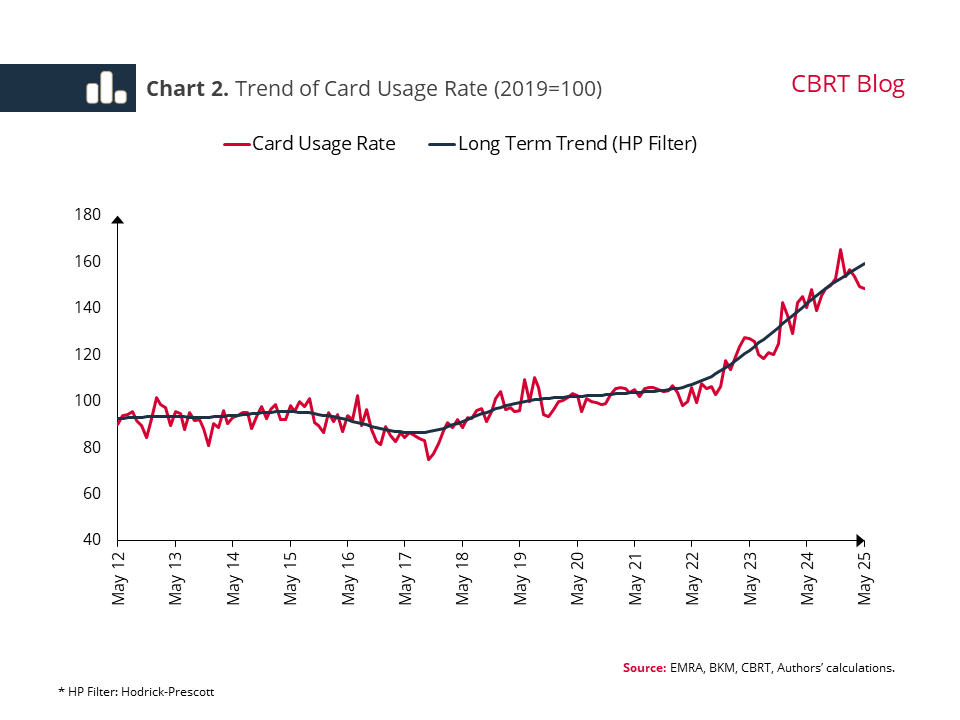
To gauge card usage rates, we need data on total consumers' expenditures. The fuel sector serves as a valuable reference in this context, as both total sales and card-based transactions are observable. By calculating the ratio of card spending to total fuel sales, we derive a sector-specific card usage rate. This ration surged markedly after 2021 (Chart 2).[2] Assuming similar dynamics apply in other sectors, we can use this fuel-sector benchmark to adjust broader consumption data for the rising preference toward card payments. This adjustment enables a more accurate representation of overall consumer spending trends.
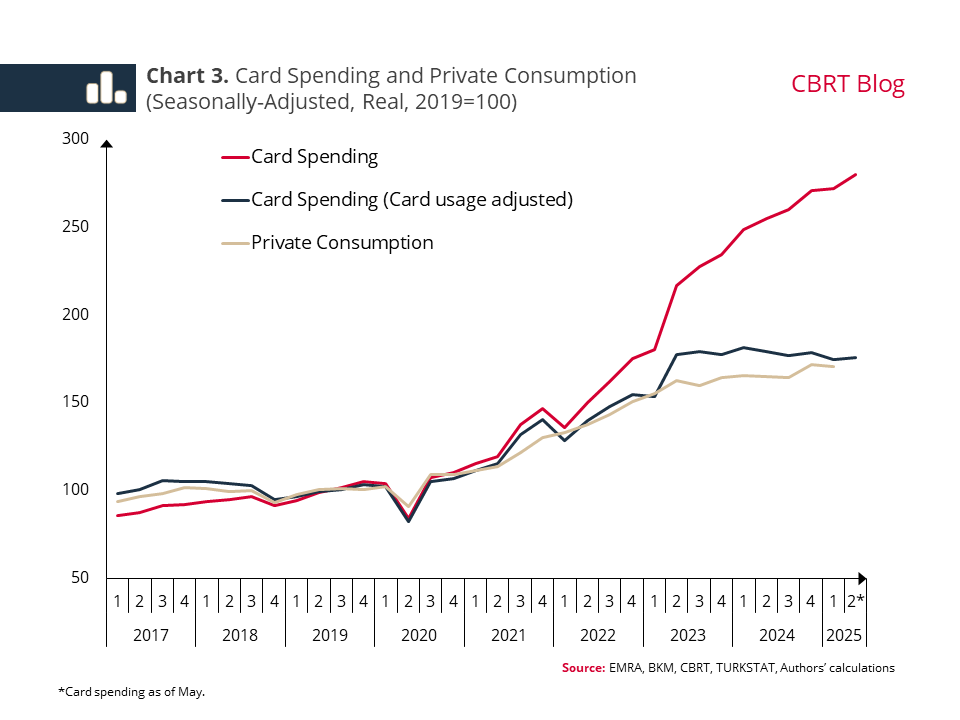
To track card spending as a more reliable demand indicator, we first apply our estimated card usage rate to construct a series that corrects for payment preference. We then remove price effects to isolate real consumption trends.[3] This two-step process reveals a significant divergence between adjusted and unadjusted card spending since 2021 (Chart 3). During this period marked by rising card usage rates, raw card spending exhibits strong acceleration. Adjusted for card usage preferences, however, the rise in card spending appears more moderate. Moreover, except for some short-term fluctuations, the adjusted card spending data aligns closely with private consumption.[4]
In sum, card spending is a very important indicator for monitoring private consumption. However, in recent years, it has decoupled from private consumption, largely due to consumers shifting from cash to card payments. Therefore, interpreting card spending data without adjusting for this structural shift may overstate the strength of consumer demand. When adjusted for this effect, we see that card spending increased more moderately in recent years, particularly following the onset of monetary tightening, aligning more closely with private consumption.
[1] The private consumption expenditures item in the GDP can provide information on consumption demand only with a lag, as it is released 60 days after the reference period.
[2] To calculate the card usage rate, we divided fuel expenditures paid by card by total fuel sales. To find total fuel sales, we used fuel data at daily frequency, based on gas stations and fuel types. Since there is no station-based data for the period before 2020, we multiplied the monthly sales amounts published by EMRA by the relevant price items in the CPI to find total fuel sales.
[3] As card spending primarily consist of retail trade purchases, we consider them to be more consistent with the retail sales data. Accordingly, we obtain price series for food, beverages and tobacco, clothing and footwear, and fuel groups, whose sub-items are well-matched, from retail sales data. For other groups that require more detailed and item-by-item matching, we use CPI sub-items (5 digits). We compare the data with the Merchant Category Codes (MCC) classification on the card spending side and with the Classification of Individual Consumption by Purpose (COICOP) on the CPI side.
[4] Card spending statistics may differ from private consumption in terms of scope and calculation methodology. For instance, the automotive sector is included in private consumption but not in the data set for card expenditures. Furthermore, discrepancies in the methodologies for adjusting the indices for price effects, as well as variations in the scope of the data, may also lead to periodic divergences.