Producer prices are an indicator for capturing cost-side pressures on consumer prices. However, in some periods, these prices differ significantly from each other. For example, the difference between the annual change (17.28 percent) in the Domestic Producer Prices Index (D-PPI) and the annual change (11.90 percent) in the Consumer Prices Index (CPI) was more than 5 points in October. This raises the question “why is there such a big divergence between consumer and producer price indices that are normally expected to be closely related?” This blog post aims to reveal the reasons for the divergence between the two indices and offer an analysis of their relationship.
Why Do Producer and Consumer Prices Diverge?
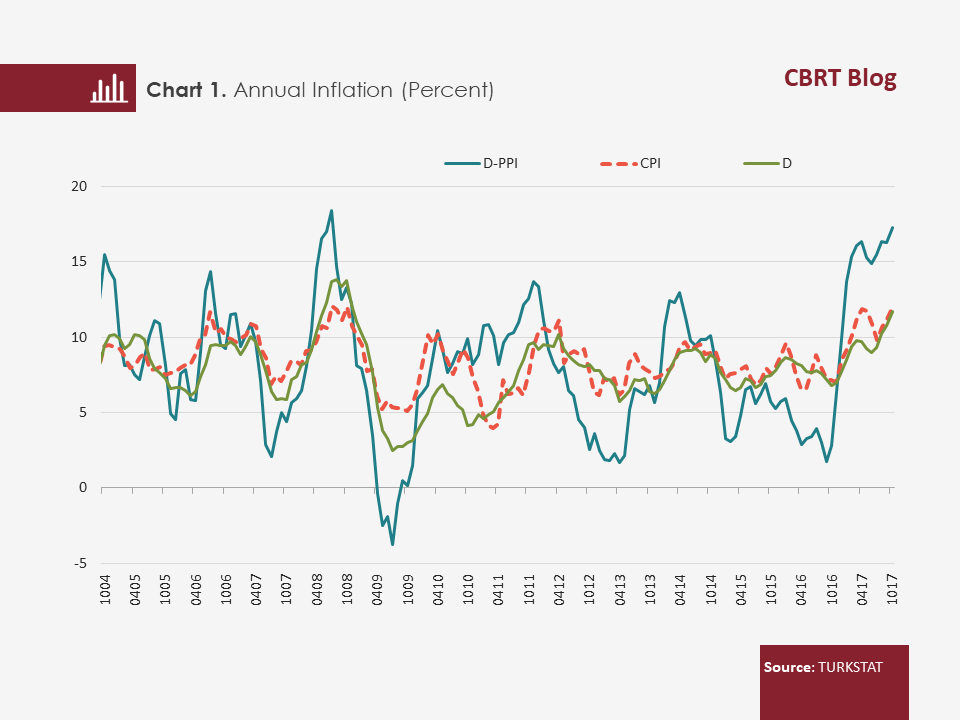
A close look at the annual changes in CPI and D-PPI presented in Chart 1 shows that producer prices are much more volatile than consumer prices. The main reason is that producer prices have higher sensitivity to exchange rate and import prices. On the other hand, when we look at the long-term averages (January 2004-October 2017), we see that the average annual change in D-PPI is 8.2 percent while that of CPI and CPI excluding unprocessed food and tobacco products (D index) hovers around 8.4 percent and 7.9 percent, respectively. Thus, we can say that the divergence is short-lived, and the two series converge in the long term.
Well, why do these two series diverge in the short term? Why is there not a full and contemporaneous pass-through from producer prices to consumer prices? There are various factors. First of all, taxes included in consumer prices are excluded from D-PPI. By definition, D-PPI is measured by compiling the producer prices of domestically manufactured products that exclude indirect taxes whereas CPI is compiled by using final sales prices which include these taxes. Therefore, inclusion of items such as fuel and tobacco products in CPI explains most of the divergence from producer prices given the high share of indirect taxes in the final prices of these products (Atuk et al., 2013). Another significant factor is the differences in the content. Services prices, which constitute about 30 percent of the consumption basket, are not included in producer prices. In fact, compilation of PPI with tax free prices and the exclusion of services prices, which are the most rigid part of consumer inflation, explain why D-PPI is much more volatile. Producer prices respond more rapidly and sharply to international price and exchange rate developments that affect Turkey as an open economy, and may display temporarily high volatility.
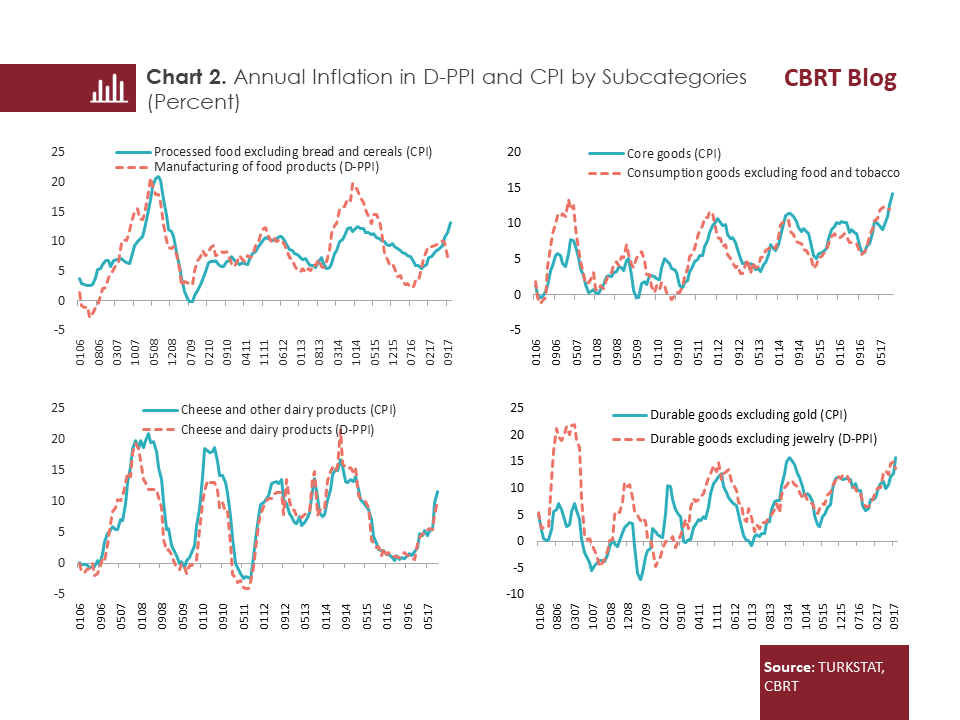
In addition to indirect taxes and items covered, structural and cyclical factors such as market structure, pricing behavior and varying sensitivity of index items to economic developments also affect the pass-through from producer prices to consumer prices. As a matter of fact, when we minimize these factors by focusing on product groups that more closely overlap in definition, we see that producer and consumer prices are more strongly correlated (Chart 2).
VAR Model for Pass-Through
How much of the producer price movements do pass through to consumer prices, and how long does it take? To answer this question, we estimate various vector autoregression (VAR) models by employing both headline indices and narrower price definitions. Using the impulse-response functions we obtain from these estimations, we infer the speed and size of pass-through. In the models we estimate for the 2005Q1- 2017Q3 period, we employ the stationary data for producer prices, consumer prices, output gap, import prices, and external demand.[1] Since the domestic producer prices index excludes agricultural products, we use the D index that excludes unprocessed food, alcoholic beverages and tobacco products as a conjugate of consumer prices in the analysis. In addition to broader price definitions, we also look at various narrower price definitions to answer the question of whether the size of pass-through differs from headline indices in the subcategories.
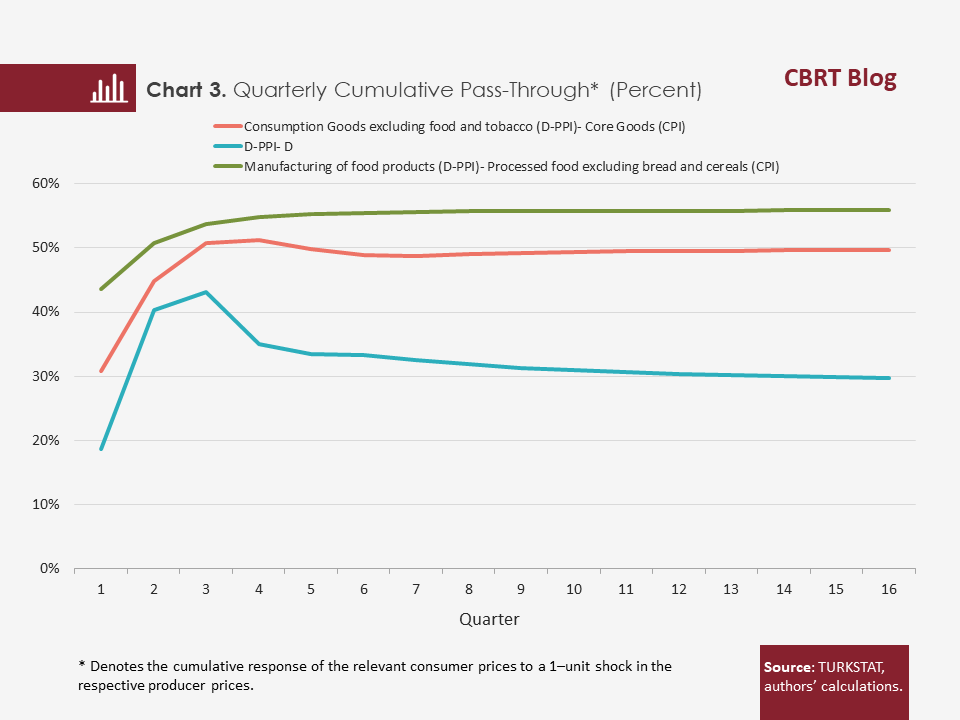
Estimations indicate a 30-percent pass-through from D-PPI to D index for a two-year period. In other words, we estimate that 30 percent of a shock coming to producer prices will be reflected in consumer prices after two years. On the other hand, we see that the pass-through from producer prices to consumer prices increases as the price definition gets narrower. The cumulative pass-through is 50 percent between producer prices of consumption goods excluding food and consumer prices of core goods, and 56 percent between food manufacturing prices and prices of processed food excluding bread and cereal (Chart 3). A great portion of the pass-through is completed in three quarters for food, whereas it takes longer for broader price definitions. However, it should be noted that although the pass-through from producer to consumer prices is stronger for narrow price definitions compared to broad price definitions, it is not still a one-to-one pass-through.
To sum up…
After the annual D-PPI inflation sharply increased and outpaced the CPI inflation in the recent period, the question of whether the CPI inflation will also display a similar pattern in the upcoming period has become an issue of concern. By their nature, producer prices are more sensitive to exchange rate and import price shocks than consumer prices. Differences in definition and content are also influential in the divergence between producer and consumer prices. Therefore, we should not expect a one-to-one pass-through from producer prices to consumer prices. Historically, annual inflation averages in these two series are very close to each other but the difference between the rates of increase in these series grows in favor of producer prices during periods of import cost shocks (such as exchange rates and oil prices). Accordingly, it is natural that there was a divergence between D-PPI and CPI in 2017 when oil prices and exchange rates displayed significant movements.
[1] For more detailed information about the models, please see Inflation Report 2017-IV, Box 3.1.
Bibliography
Atuk, O., F. Öğünç, M.U. Özmen and Ç. Sarıkaya, 2013, Türkiye’de Üretici ve Tüketici Fiyatları Arasındaki ilişki Üzerine bir Değerlendirme (An Assessment of the Link between Producer and Consumer Prices in Turkey, in Turkish only), CBRT Research Notes in Economics No. 2013/21.